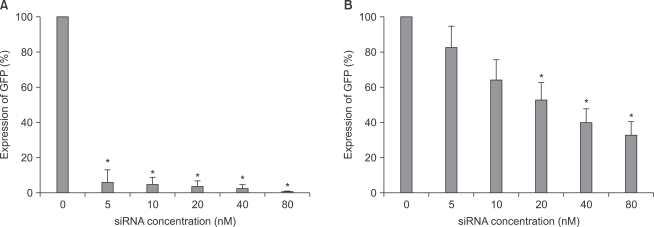
Fig. 5.
The quantification of GFP gene expression using image analysis in both astrocytes (A) and microglial cells (B). The GFP gene expression level was determined by counting the number of transfected cells (counted fluorescent positive cell/total counted cell). The transfected cells values are means ± SD of three independent experiments (*P < 0.05, n = 6). GFP: green fluorescent protein.

