
Fig. 5.
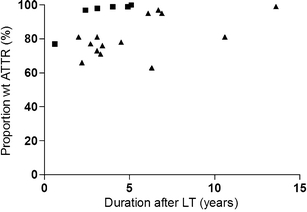
Correlation between time elapsed after liver transplantation and proportion of wild-type molecules among full-length ATTR species in adipose amyloid fibrils. Each measure point represents one individual. Black square, fibrils with fragmented ATTR (type A); black triangle, fibrils without fragmented ATTR (type B). The figure shows that the higher percentage of wild-type ATTR found among fragment-containing fibrils is not due to longer duration after transplantation among these patients compared to the patients lacking fragments. A possible correlation between wt proportion and duration after LT is seen within each fibril type group (r = 0.99, p = 0.003 for type A and r = 0.52, p = 0.05 for type B), but not when both groups are combined (r = 0.36, p = 0.1)