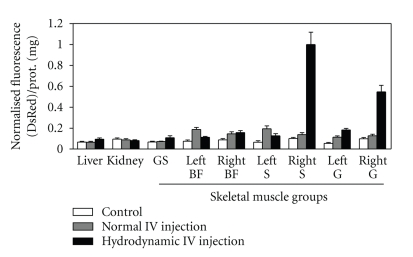
Figure 2.
In vivo organ distribution study by DsRed protein fluorescence measurements. The normal female Lewis rats were allocated to 3 groups and each consisting of 3 animals. One group, serving as normal controls, received 4 ml of saline injected with the hydrodynamic technique via the femoral vein. Another two Groups received 200 μg DsRed plasmids DNA prepared with 4 ml saline injected by normal femoral vein injection and hydrodynamic femoral vein injection, respectively. The rats were sacrificed 6 to 8 days following injection. The tissue sections of liver, kidney, and skeletal muscle were removed, cleaned, and homogenised. The samples suspensions were then stored in −80°C until the day the measurements are done. The DsRed plasmids DNA, coding for fluorescent emitting proteins, were measured by detecting the emitted DsRed fluorescence wave, with a maximum excitation at 555 nm and maximal emission at 583 nm. The skeletal muscle groups included gluteus superficialis (GS), Femoris Bicep of left and right hindlimbs (Left BF and Right BF), soleus of left and right hindlimbs (Left S and Right S), and gastro of left and right hindlimbs (Left G and Right G). Values were shown as mean ± SEM of normalised DsRed fluorescence/protein (mg) of 3 rats of each group. All values were subjected to t test and one-way ANOVA analysis. A value of 0.05 was considered significant. The highest value of fluorescent spectra (right soleus muscle section) is set as 1.

