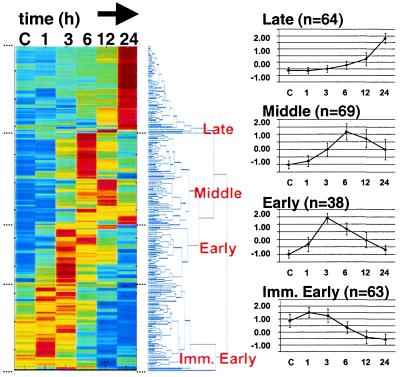
Figure 1.
Temporal expression clusters of genes regulated by potassium and serum-withdrawal. (Left) Hierarchical clustering was used to order 234 significantly regulated genes. Each colored row represents an expression profile for an individual gene. From left to right, control (C), 1, 3, 6, 12, and 24 h post-KS-W expression values for each gene were scaled based on the number of standard deviations from the mean intensity of each gene. Scaled expression values were color-coded such that red, yellow, and blue indicate above, at, and below mean intensity, respectively. The distance between branches in the dendrogram is proportional to the relatedness between expression patterns based on a Euclidean metric; neighboring genes are most alike. (Right) For the four major branches (Late, Middle, Early, and Immediate Early) we graphed the average profile (n = total number for each class) ± the standard deviation. Supplemental data, Table 4 provides the gene expression data.

