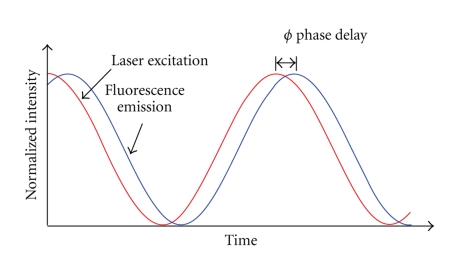
Figure 4.
Illustration of frequency-domain fluorescence lifetime measurement. The excitation light (red) is modulated in amplitude at a frequency ω, while the fluorescence light (blue) is emitted with the same modulation frequency but with a phase shift in time, ϕ. For a single exponential lifetime, the value of the fluorescence lifetime is related by tanϕ = ωτ.

