
Figure 5.
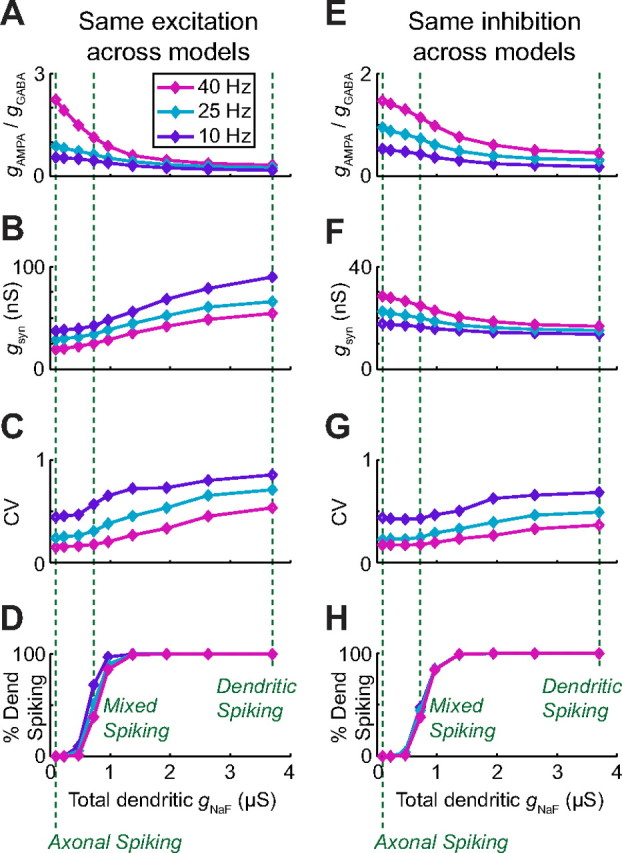
Dendritic sodium channels enhance spike-time variability across a wide range of high-conductance input conditions. For each of the nine model neurons, excitatory and inhibitory synapses were uniformly distributed in all dendritic compartments and activated randomly. A–D, In some simulations, the excitatory rate was the same for all models (10,220 synaptic events per second, 13 Hz per biological synapse; see Materials and Methods) while inhibition was varied independently for each model neuron to achieve output spike rates of 10, 25, and 40 Hz. E–H, In a different set of simulations, the model neurons all received identical inhibition (3066 events per second; 0.6 Hz per synapse), while excitation was adjusted independently to reach the same output rates. In both cases the ratio of excitatory to inhibitory conductance that gave the desired output spike rate was inversely related to the dendritic gNaF (A, E). As a result, when excitation was the same for all models, those with more dendritic gNaF required much more total synaptic conductance to achieve a specified spike rate because they received more inhibition (B). When inhibition was kept the same for all models, those with less dendritic gNaF received the most total synaptic conductance, because they required more excitation (F). Despite the large differences in input conditions between these two sets of simulations, the model neurons with the highest gNaF levels always had the highest variance in their spike timing as measured by the coefficient of variation of the interspike interval distribution (C, G). For both sets of simulations, the percentage of somatic action potentials that initiated in the dendrites as opposed to the axon of each model neuron was only moderately affected by the input conditions, and the nine model neurons spanned the whole range from purely axonal spike initiation to 100% dendritic spike initiation (D, H). Three of the nine model neurons (vertical dashed lines; same models as shown in Fig. 4) were selected to represent different spike initiation cases for additional analysis: one with purely axonal spike initiation, one with a mixture of axonal and dendritic spike initiation, and one with 100% dendritic spike initiation.