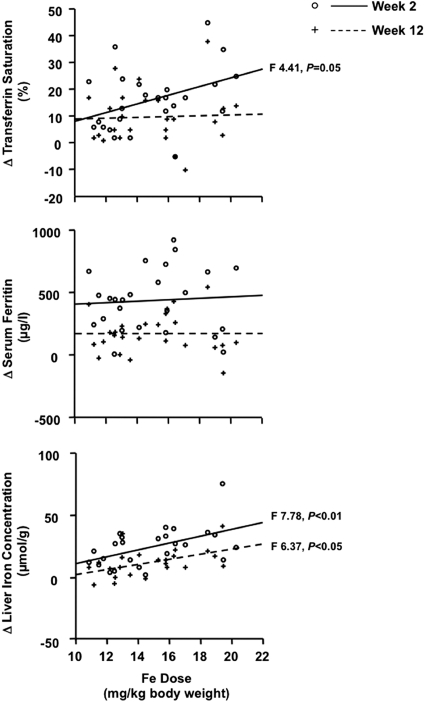
Figure 3.
Changes, compared with baseline, in serum ferritin, transferrin saturation, and liver iron concentration in 25 iron-deficient CKD patients not yet on dialysis in relation to the administered Fe dose. Individual changes and regression line are (○/——) at week 2 and (+/-----) at week 12, respectively.

