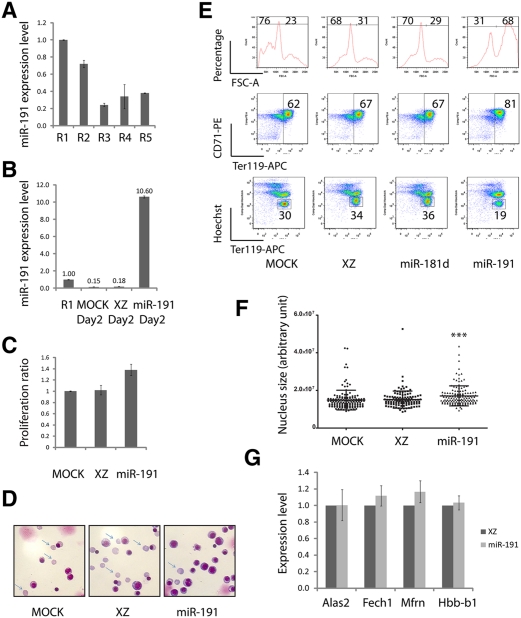
Figure 2.
miR-191 regulates cultured mouse fetal erythroblast enucleation. (A) miR-191 expression levels from R1 to R5 as determined by qRT–PCR. (B) miR-191 overexpression levels at day 2 of an in vitro cultured erythroid progenitor, as determined by qRT–PCR. (A,B) U6 was the loading control. Error bar is standard deviation (SD) (n = 3). (C) Mouse fetal erythroid progenitors were infected with indicated viruses. Twelve hours after infection, GFP+ cells were sorted and cultured for another 36 h. The numbers of GFP+ cells at 12 h and 48 h were determined by a cell-counting machine (BD). The normalized ratios of cell numbers at 48 h relative to 12 h were plotted. Error bar is SD (n = 3). (D) May-Grunwald Giemsa staining carried out on day 2 cultured cells infected with indicated viruses; representative images are shown (n = 3). Arrows indicate reticulocytes. (E) Day 2 in vitro cultured cells as in D stained with Ter119-APC, CD71-PE, and Hoechst. Representative FACS plots are shown (n = 3). (F) Day 2 in vitro cultured cells as in E stained with DAPI; nucleus sizes were quantified by image processing. (***) P < 0.001 in Student t-test. (G) qRT–PCR performed on day 2 cultured cells infected with indicated viruses. Error bar is SD (n = 3).

