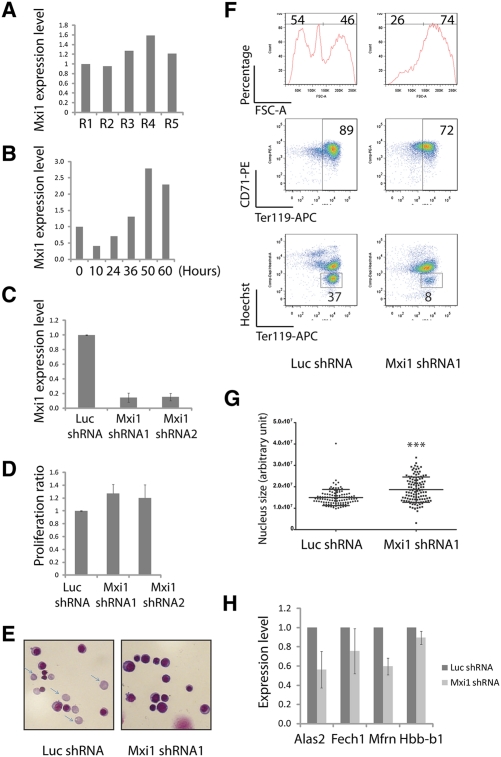
Figure 5.
Mxi1 is required for erythroblast enucleation. (A) Mxi1 mRNA expression levels from R1 to R5, as determined by qRT–PCR. 18s rRNA was the loading control. (B) Mxi1 expression levels of in vitro cultured erythroid progenitors, as determined by qRT–PCR. 18s was the loading control. Error bar is SD (n = 3). (C) Mxi1 mRNA levels at day 2 of culture following addition of shRNAs, determined by qRT–PCR. 18s rRNA was the loading control. Error bar is SD (n = 3). (D) Similar to Figure 2C; for samples with infection of indicated viruses, the normalized ratios of cell numbers at 48 h relative to 12 h were plotted. Error bar is SD (n = 3). (E) May-Grunwald Giemsa staining carried out on day 2 cultured cells infected with indicated viruses; representative images are shown (n = 3). Arrows indicate reticulocytes. (F) Day 2 in vitro cultured cells, as in E, stained with Ter119-APC, CD71-PE, and Hoechst. Representative FACS plots are shown (n = 3). (G) Day 2 in vitro cultured cells, as in F, stained with DAPI; nucleus sizes were quantified by image processing. (***) P < 0.001 in Student t-test. (H) qRT–PCR performed on day 2 cultured cells infected with indicated viruses. Error bar is SD (n = 3).

