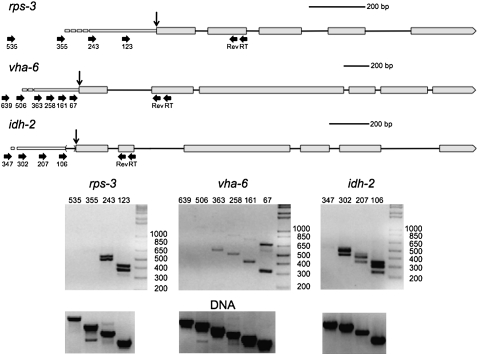
FIGURE 1.
Localization of transcriptional start sites of trans-spliced genes by RT-PCR. Schematic representation of the rps-3, vha-6, and idh-2 pre-mRNAs, including their proposed outrons. In all figures, exons are indicated by boxes, and introns by lines. Trans-splice sites are indicated by vertical arrows. The forward and reverse primer sites are indicated by horizontal arrows. Scale bars are shown for each diagram. Primers for reverse transcription (RT) and reverse primers for PCR (Rev) are indicated under the second exons. Forward primers are named according to their location (in bp) upstream of the trans-splice sites. Since the exact transcriptional start site is known only to fall somewhere between the most 5′ primer that gives a product and the next upstream one that does not, the 5′ ends of the outrons are depicted as dashes. Gels (below) show RT-PCR products using the primers shown above. Some of the RNA has been cis-spliced as well as trans-spliced, so there are two bands in each lane: one including an intron and one without. The bands resulting from intron-containing RNA are visible but faint with primers 363, 258, and 161 on the vha-6 gel. RNA from the idh-2 gene produces extra bands in each lane, since the trans-splice site sometimes serves as the 3′ splice site for the removal of a small intron upstream of the first coding exon. The lowest band is at the position expected for removal of both introns; the largest band is at the position expected for removal of neither intron; and the middle band is at the position expected for removal of either intron. The forward primers used in the reactions are shown along the tops of the gels. Gels of the products of PCRs from C. elegans (N2) genomic DNA (lower gels) verify the specificity of the primer pairs used in the analysis.

