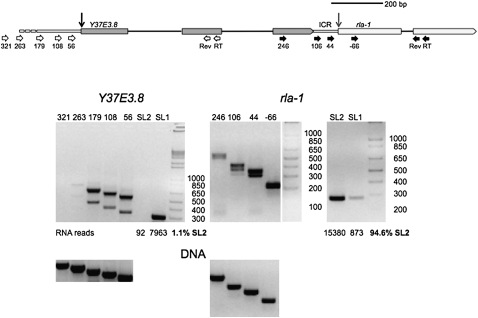
FIGURE 2.
RT-PCR analysis of transcripts from an operon. Diagram of the Y37E3.8 operon. Y37E3.8 is the upstream gene and rla-1 is the downstream gene. The genes are separated by a 110-bp intercistronic region (ICR), depicted as a narrow bar between them. The Y37E3.8 RNA trans-splice site is indicated by a black vertical arrow and the rla-1 RNA trans-splice site is indicated by a gray vertical arrow. Primers are measured from these trans-splice sites and are indicated by white horizontal arrows for Y37E3.8 and black horizontal arrows for rla-1. Gels of RT-PCR products show that, as expected, Y37E3.8 RNA is trans-spliced to SL1 whereas rla-1 RNA is trans-spliced primarily to SL2. The analysis of the transcriptional start site is as shown in Figure 1. The start site for Y37E3.8 transcription can be estimated, while rla-1 transcription proceeds from the upstream gene, as would be expected for a downstream gene in an operon. Some RNA has been cis-spliced, so two bands are present. RNA reads are taken from Illumina sequencing of polyadenylated RNA, by Hillier et al. (2009), and the percentage of SL2 trans-spliced RNA is calculated from this data.

