
Figure 1. Scale and relentless growth of the unknown protein and orphan enzyme problems.
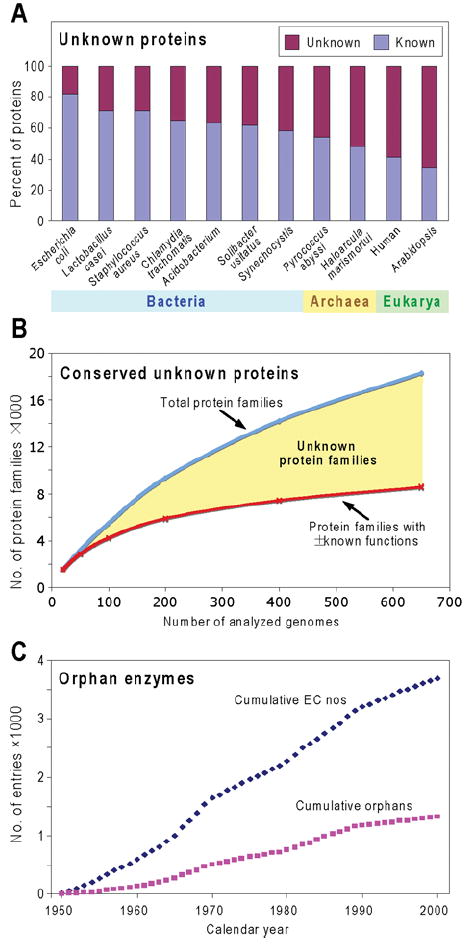
(A) The percentages of known and unknown proteins encoded by representative genomes. The numbers of known proteins were estimated from the SEED database by summing protein-encoding genes included in subsystems and those with non-hypothetical functions not in subsystems. Since this assumes that all proteins in subsystems have known functions, and some such functions are merely reasonable hypotheses, this gives a generous estimate of known proteins. (B) A qualitative sketch of the relationship between the number of conserved unknown proteins and the number of genomes sequenced, from an exploratory analysis by R. Overbeek and A. L. Osterman (personal communication). The SEED database was used to estimate the number of protein families (corresponding roughly to orthologues) comprising at least five members from genomes representing two or more genera (thereby excluding very local families). A jackknife approach was then used to compute an average number of families (blue curve) in bundles (‘runs’) of progressively increased size from 20 genomes up to 650 genomes per run. The lower curve in red shows the number of families having at least some elements of function assigned (i.e. at least a general function such as ‘sugar kinase’ deduced from homology). Note again the generosity of this estimate of the number of proteins that have a known function. The yellow area between the curves represents the number of unknown families. (C) Cumulative total numbers of biochemical activities (EC numbers) characterized between 1950 and 2000, and those that are still orphans. Data are derived from Figure 1 of [33].