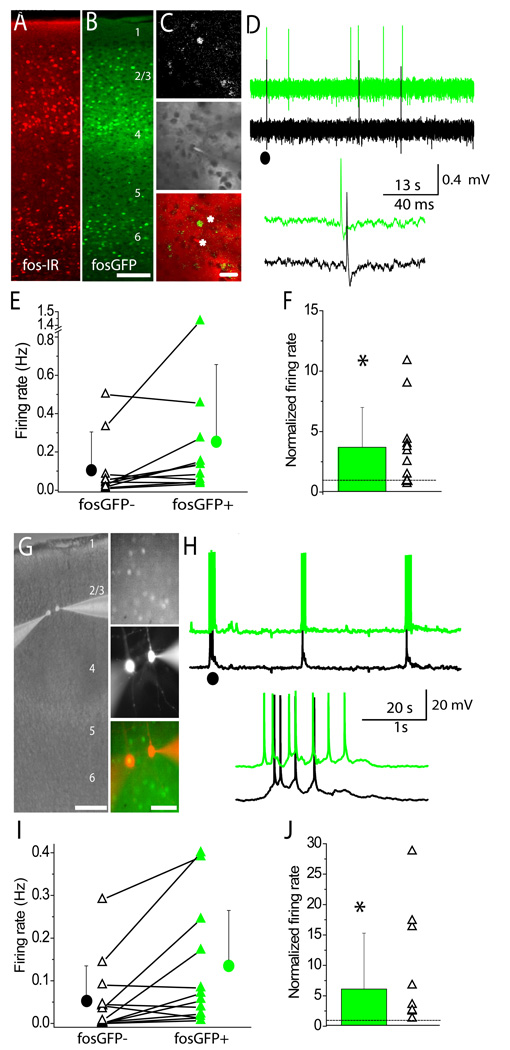
Figure 1. Fos-expressing pyramidal neurons in layer 2/3 exhibit higher spontaneous firing rates in vivo.
(A) Fos-IR from wild-type animals. (B) Intrinsic fluorescence from fosGFP transgenic animals. Scale=100µm. (C) (Top) In vivo fosGFP expression in layer 2/3 barrel cortex. (Middle) Dual electrode recording set-up in vivo, where cell bodies are visualized by “shadows” created by the red fluorescent dye Alexa-568. (Bottom) Overlay of images. Asterisks indicate electrode positions. Scale= 20 µM. (D) Example trace from a simultaneously-recorded juxtacellular fosGFP− (black) and fosGFP+ (green) pair. Top traces were filtered and offset for clarity; inset below shows a detail from (●) above. (E) Scatter plot showing firing rates for each recorded pair, mean firing rates are also plotted. (F) Firing rates of fosGFP− cells normalized to paired fosGFP+ firing rate as mean (bar) and scatter (points). Dotted line represents ratio of one. (G) (Left) Recording set-up for dual whole-cell recordings in layer 2/3 pyramidal neurons in acute slices. Scale=200 µM. (Right-Top) FosGFP expression in vitro. (Middle) Alexa-568 filled fosGFP− and fosGFP+ neurons after recording. (Bottom) Overlay of images. Scale=50 µM. (H) Example trace from fosGFP− (black) and fosGFP+ (green) pair. Conventions in (I) and (J) as in (E) and (F)

