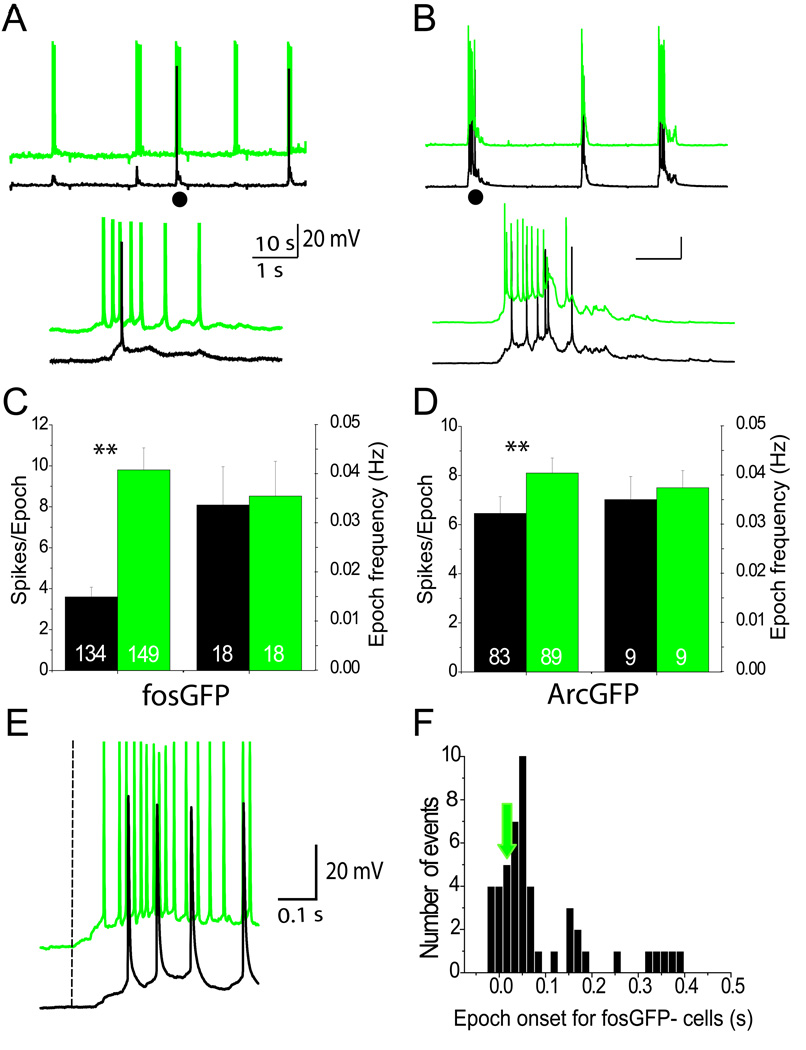
Figure 2. IEG-expressing neurons fire at higher frequencies during network activity.
(A–B) Spontaneous firing activity from a pair of simultaneously-recorded fosGFP− and fosGFP+ neurons (A) and ArcGFP− and ArcGFP+ neurons (B). Traces have been offset for clarity. Inset below (●) shows higher temporal resolution of firing. (C) The number of spikes per epoch was significantly different for fosGFP− (black) and fosGFP+ (green) cells (n=number of epochs for each group). The frequency of depolarizing epochs for simultaneously recorded fosGFP+ and fosGFP− cells is similar (p=0.14). (D) Same as in (C) but for ArcGFP − (black) and ArcGFP+ (green) cells. (E) Example traces showing depolarizing epochs begin earlier for fosGFP+ cells (dotted line) compared to simultaneously-recorded fosGFP− cells. (F) Histogram of the timing of epoch onset for a representative subset of fosGFP− cells relative to fosGFP+ cells. Epoch onset times for fosGFP− cells are shifted later (0=time of epoch onset for fosGFP+ cells; green arrow).

