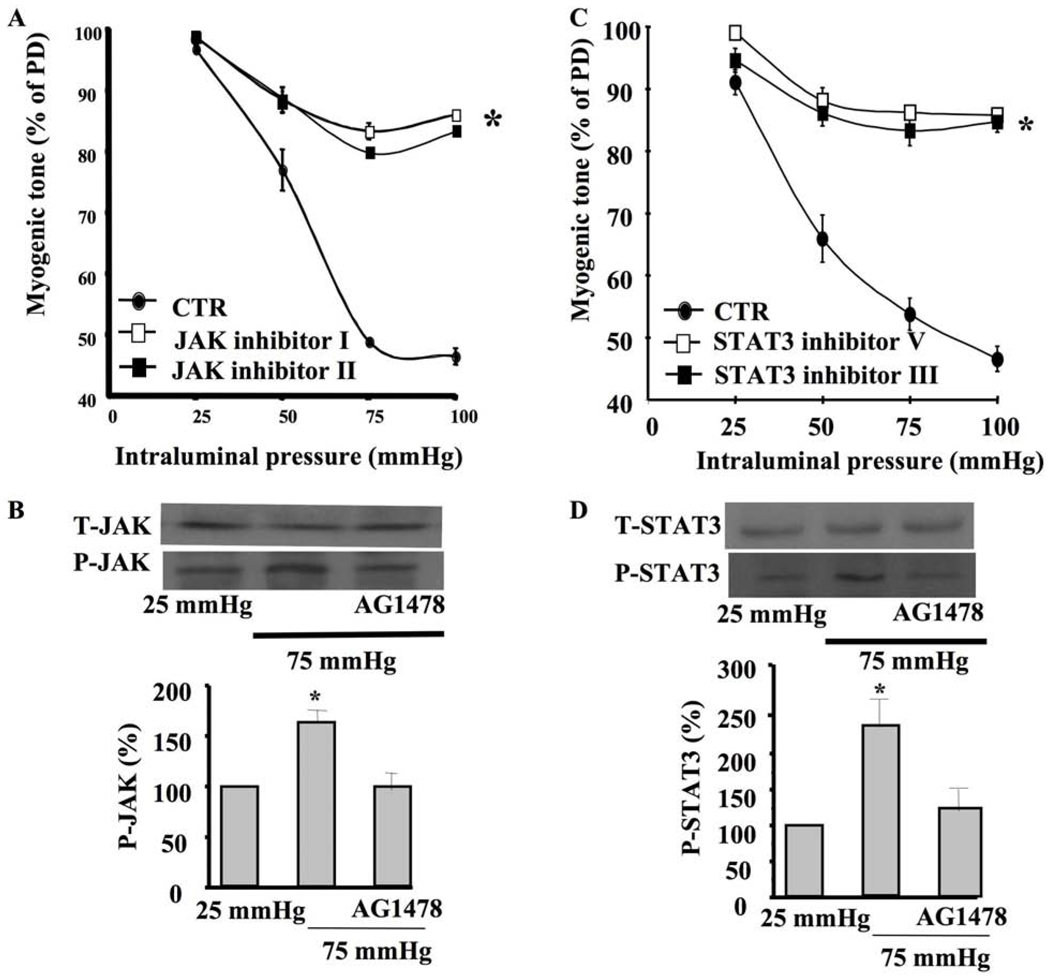
Figure 2. Coronary arteriolar myogenic tone, JAK and STAT3.
2A: Pressure-induced myogenic tone in coronary arterioles with and without JAK inhibitor (JAK inhibitor I and JAK inhibitor II, 1 µM) n=6, *P<0.05 CTR vs. JAK inhibitor; 2B: Western blot analysis and cumulative data showing phosphorylated (P)-JAK and Total (T)-JAK in coronary arterioles stimulated with intraluminal pressure 25 and 75 mm Hg ± EGFR tyrosine kinase inhibitor (AG1478, 1 µM) n=4; 2C: Pressure-induced myogenic tone in coronary arterioles with and without STAT3 inhibitor (STAT3 inhibitor V and STAT3 inhibitor III, 1 µM) n=6, *P<0.05 CTR vs. STAT3 inhibitor; 2D: Western blot analysis and cumulative data showing phosphorylated (P)-STAT3 and Total (T)-STAT3 in coronary arterioles stimulated with intraluminal pressure 25 and 75 mm Hg ± EGFR tyrosine kinase inhibitor (AG1478, 1 µM) n=4.

