
Fig. 3.
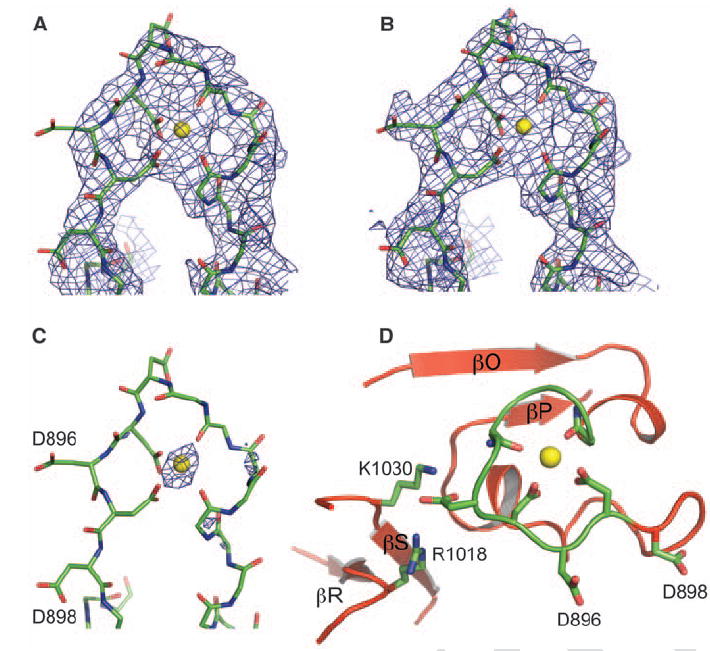
The Ca2+ bowl. (A) Experimental electron density at 3.3 Å in the Ca2+ bowl region contoured at 1.0 above the mean density, where σ is the RMSD of the density (B and C) Weighted 2fo-fc electron density at 3.0 Å after refinement contoured at 1.0 σ and 4.0 σ, respectively. The final refined model is shown as sticks, with most side chains removed for clarity. (D) Structure of the Ca2+ bowl, showing key residues coordinating the Ca2+ ion (yellow sphere).