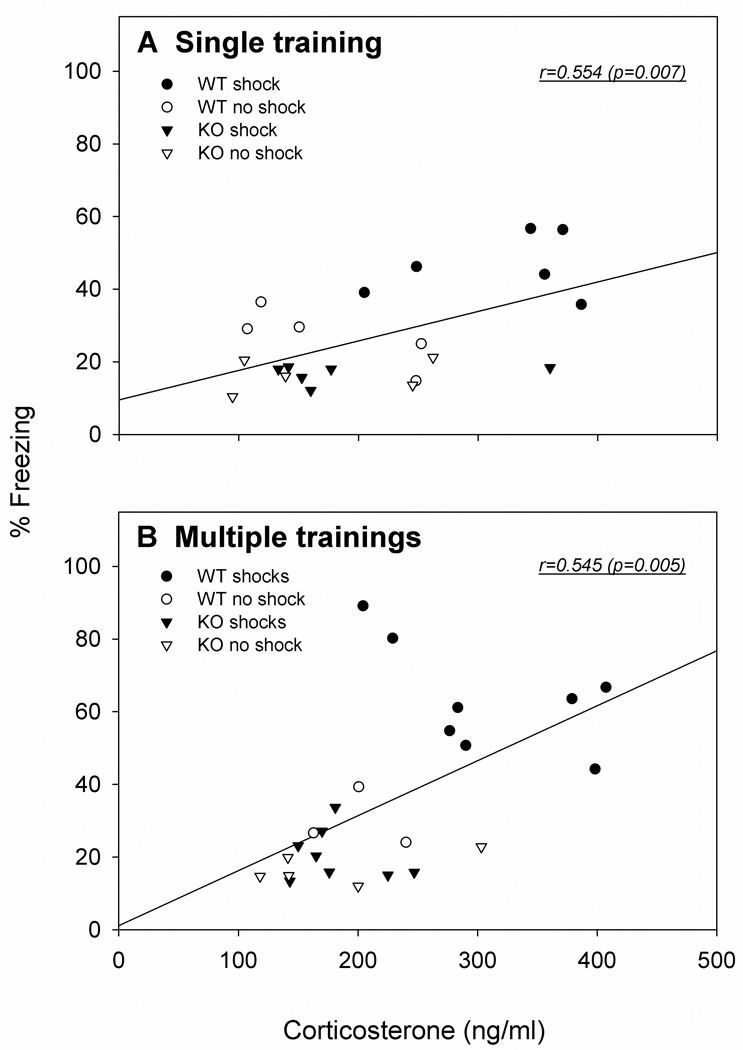
Figure 4.
Correlations between the expression of visually cued LTM (% Freezing) and plasma corticosterone (ng/ml) 15 min after the LTM tests. (A) For a single training, the magnitude of freezing during the visual cue test correlated with the magnitude of corticosterone responses in WT and KO mice: WT shock (●, n=6); WT no shock (○, n=5); nNOS KO shock (▼, n=6); KO no shock (▽, n=5). (B) For multiple trainings, the magnitude of freezing during the visual cue test correlated with corticosterone responses in WT and nNOS KO mice: WT shock (●, n=8); WT no shock (○, n=3); nNOS KO shock (▼, n=8); nNOS KO no shock (▽, n=5).

