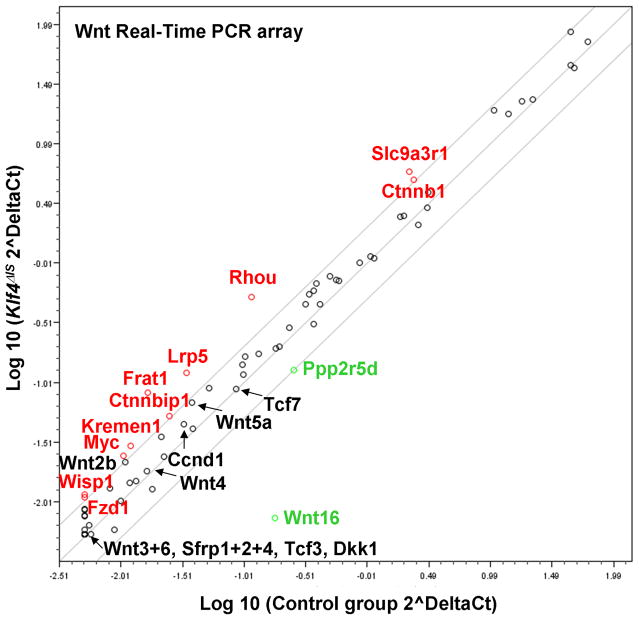
Figure 6. Comparison of expression of Wnt pathway genes in the small intestines of Klf4ΔIS and control mice.
Shown is a scatter plot of expression levels of Wnt pathway genes in the intestines of Klf4 mutant and control mice as determined by real-time PCR analysis. The analysis was conducted with pooled RNA specimens from three mice for each genotype. Transcripts with two or more fold-increase in the Klf4 mutant mice compared to the controls are labeled in red and those with two or more fold-decrease in the Klf4 mutant mice are labeled in green. Detailed results are shown in Suppl. Table S1.

