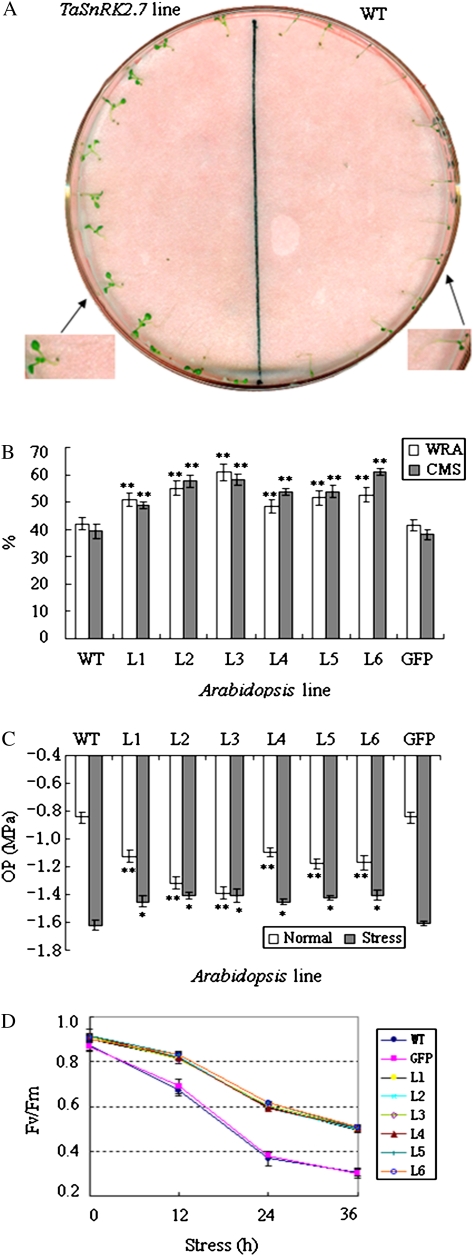
Fig. 9.
Physiological characterization of TaSnRK2.7 plants. (A) Seedling phenotypes of TaSnRK2.7-overexpressing lines and WT under salinity stress for 5 h. (B) Comparison of CMS and WRA of transgenic plants and controls under stress. (C) TaSnRK2.7 plants had significantly lower OP than WT and GFP controls under normal conditions. One day after treatment with 300 mM NaCl, OP in WT and GFP controls had decreased more rapidly and was significantly lower than in TaSnRK2.7 plants. (D) Changes in variable to maximum fluorescence ratios (Fv/Fm) in TaSnRK2.7 plants and WT and GFP controls subjected to high salt stress. L1–L6, six individual TaSnRK2.7 transgenic lines; WT, wild type; GFP, GFP transgenic line. Values are mean±SE, n=10. * Significant difference between TaSnRK2.7-overexpressing lines and controls with F-test (*P<0.05, **P<0.01). (This figure is available in colour at JXB online.)

