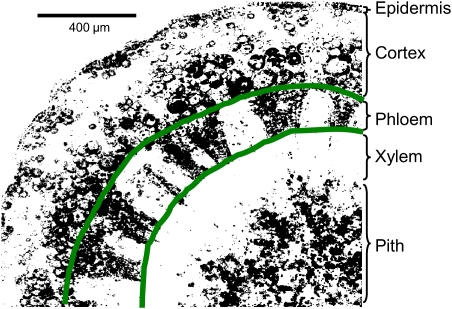
Fig. 5.
Example of image processing for a rachis cross-section stained with FDA and analysed for percentage fluorescing area by hand-tracing the phloem region. The percentage fluorescing area (37% in this example) corresponds to the percentage of live cells within the traced area. (This figure is available in colour at JXB online.)

