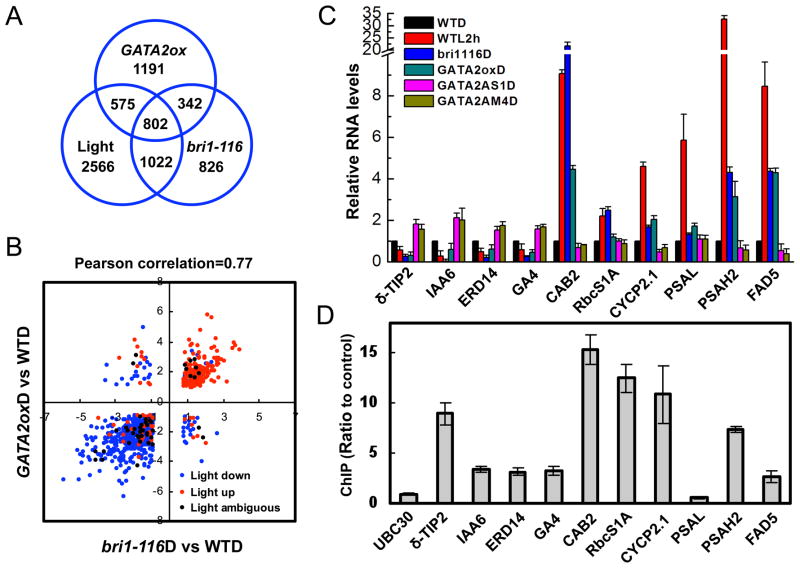
Figure 3. GATA2 directly regulates genes that are responsive to both BR and light.
(A) Venn diagrams of the number of genes differentially expressed in the dark-grown GATA2-ox vs WT, genes affected in the bri1-116 mutant, and genes affected in at least one of the light-treatment microarray experiments (see also Table S1). The numbers in the overlapping areas indicate the number of shared genes. (B) Scatter plot of log2 fold change values of GATA2-ox vs WT and bri1-116 vs WT for 802 genes differentially expressed in dark-grown GATA2-ox vs WT, bri1-116 vs WT, and light-grown vs dark-grown wild type seedlings. Effects of light treatment on the expression are denoted by color as shown (see also Table S1). (C) Quantitative RT-PCR analysis of a number of known light-responsive genes in GATA2-ox, GATA-AS-1, GATA-AM-4, or bri1-116 plants grown in the dark for 5 days, compared to wild type plants grown in the dark and then untreated or treated with white light for 2 hours. (D) Chromatin immunoprecipitation followed by real time PCR (ChIP-qPCR) assays of GATA2 binding to promoters of genes in panel C, performed using 35S::GATA2-YFP transgenic and wild type control seedlings grown in light for 2 weeks and an anti-GFP antibody. GATA2 binding was measured by qPCR as the ratio between GATA2-YFP and control sample. The UBC30 gene was used as a negative control. Error bars indicate SD. (See also Table S4).

