Figure 3.
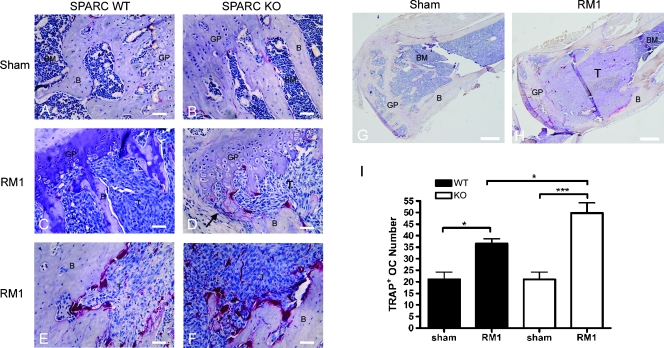
TRAP staining is increased in SPARC KO mice. A sham injection was performed as a control in SPARCWT(A) or KO (B and G) mice. RM1 cells (1 x 10³) were injected into the tibia of SPARC WT (C and E) or KO (D, F, and H) mice. Bones were isolated after 2 weeks of intraosseous tumor growth and sectioned. Osteoclasts were visualized by TRAP staining (dark red) and counterstained with hematoxylin. RM1 cells (T) can be seen growing in the proximal metaphysis and have completely replaced the bone marrow (BM). B indicates trabecular bone; GP, growth plate. Arrow indicates site of cortical breach (D). Scale bars, 50 µm (A–D); 200 µm (G and H). Representative images from nine mice are shown. (I) The number of TRAP-stained osteoclasts near the metaphysis of SPARC WT (black columns) or KO (white columns) was counted and represented as mean osteoclast number ± SD (n = 7 bones from individual mice). *P < .05 and ***P < .001 by one-way ANOVA.

