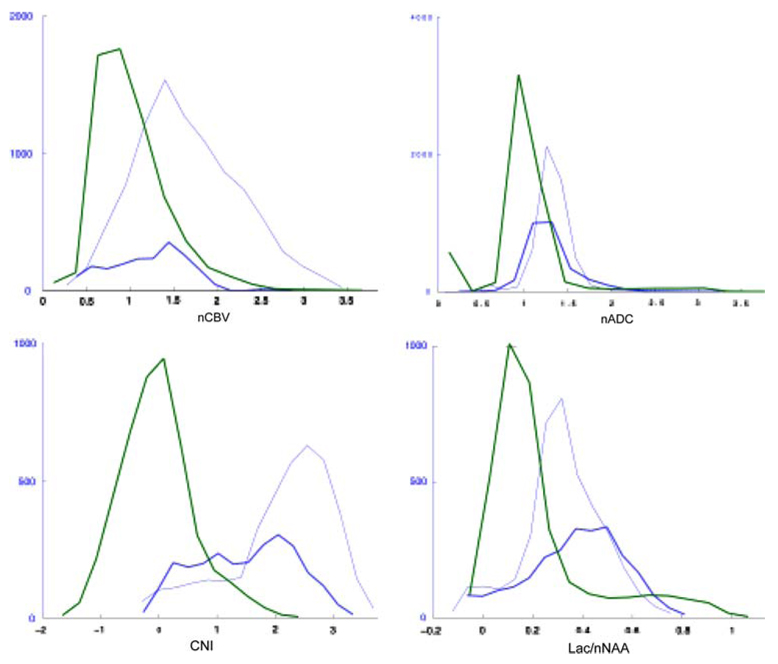
Fig. 6.
Distribution of rCBV, ADC, CNI and Lac/nNAA values in normal appearing white matter (NAWM—green curves), contrast enhancement lesion (CEL—dark blue curves) and non-enhancing lesion (NEL—light blue curves) regions for the patient who was shown in Fig. 1

