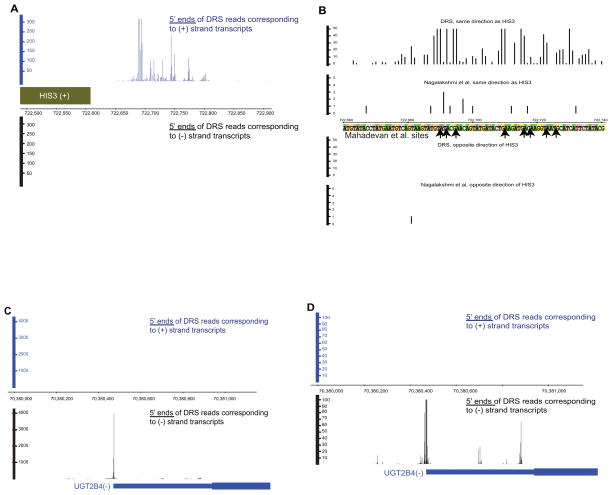
Figure 1. Polyadenylation site detection in yeast (A,B) and human (C,D).
(A) The blue and black panels show the DRS reads emanating from transcripts in the + and − direction, respectively. The major peaks in the blue panel correspond to the 13 polyadenylation sites at locations 722690, 722692, 722695, 722710, 722716, 722718, 722723, 722726, 722746, 722750, 722752, 722775, and 722777 previously identified for HIS3 (Mahadevan et al., 1997) using 3′ RACE-PCR. (B) Zoomed-in view of panel A. Y axis was reduced from 0–300 scale to 0–50. X-axis was reduced from 722,500–722,900 scale to 722,660–722–740. All “end tags” identified by Nagalakshmi et al. in this region are also shown (y axis for these tags is on the scale of 0–5). Arrows mark the sites identified by Mahadevan et al. in the region shown. (C, D) Overview (B) and a zoomed-in view (C) of reads mapping to UGT2B4 3′ annotated ends. Multiple potential polyadenylation sites are evident in panel C (see also Figure S2 and Table S1).

