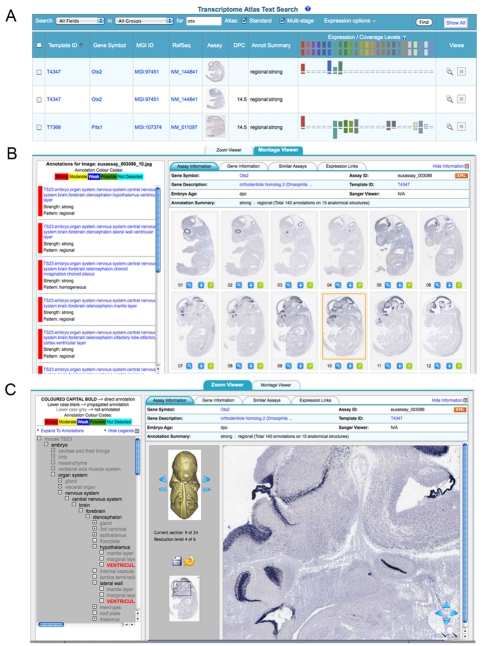
Figure 2. Snapshot view of the Web-based transcriptome atlas.
(A) Keyword search results showing a table format including a thumbnail view of an image, and visualizing each embryonic section and associated anatomical annotation, color-coded according to expression strength. (B) Clicking on a particular image allows viewing the annotation associated with the particular image (left panel). Top tabs give additional details and links to other gene expression Web sites and genomic resources. (C) Zoom viewer. The image viewer provides full resolution images with standard zoom and pan capability. In addition, the viewed section can be selected using the 3-D embryo view. The left-hand panel shows the annotation in the context of the anatomy ontology, and the tabs provide additional detail and links to other gene expression and genomic resources.

