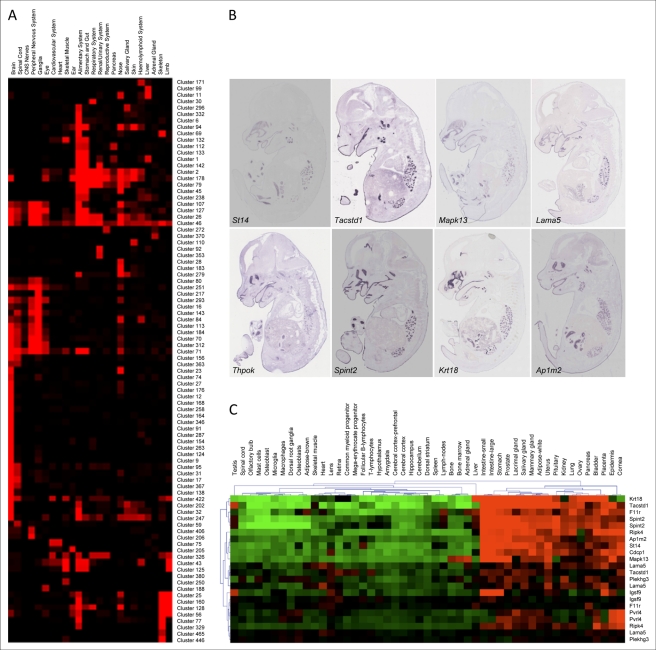
Figure 4. Hierarchical clustering of regionally expressed genes.
(A) Graphical representation of clusters (listed on the right) with more than eight genes in terms of expression occupancy. The occupancy is calculated as the number of genes in each cluster that are expressed in the anatomical structures (listed at the top) divided by the number of genes in that cluster (normalization). The matrix of occupancy values for each tissue group clusters with tissue distribution. More information on clustering can be found at http://www.eurexpress.org/ee/project/publication/PlosBiol2010.html. (B) Cluster 83, with a Pearson coefficient of 0.73, is composed of eight different genes showing expression in epithelia (oral and nasal cavities, respiratory tract, and middle and internal auditory cavities), choroid plexus, and middle-gut mucosa. (C) Genes in Cluster 83 are also synexpressed in adult tissues. Publicly available microarray data (http://symatlas.gnf.org) were clustered using the MeV program (http://www.tm4.org/mev.html). The figure shows synexpression in intestine, stomach, lacrimal gland, salivary gland, uterus, prostate, mammary gland, placenta, and bladder. Note that some tissues listed on the top of the diagram are duplicated because they represent two independent datasets. Gene symbols are on the right.

