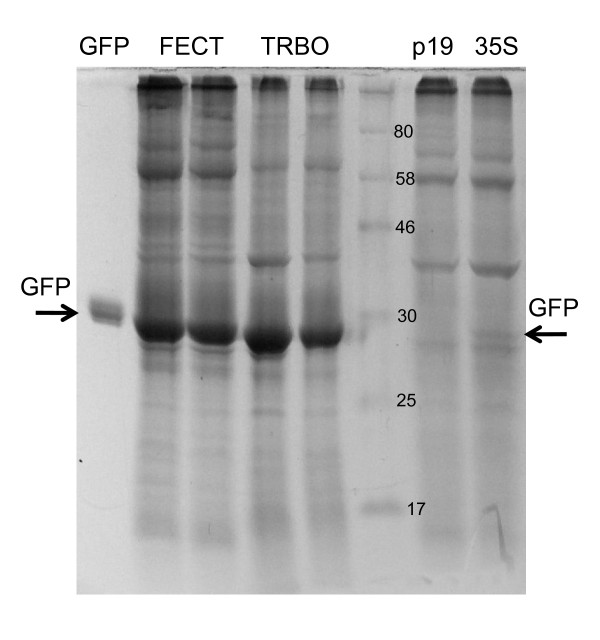
Figure 6.
Comparison of FECT40 GFP expression with TMV and 35S vectors in N. benthamiana, 7 dpi. Lane 1, 1 μg GFP standard, Lanes 2 & 3, FECT40/GFP + 35S/p19, Lanes 3 & 4, TRBO/GFP + 35S/p19, Lane 5, NEB prestained broad-range protein markers, Lane 6 35S/p19 alone, Lane 7, 35S/GFP (pGDG vector) + 35S/p19. Each sample lane represents approximately 5.5 mg fw of plant tissue.

