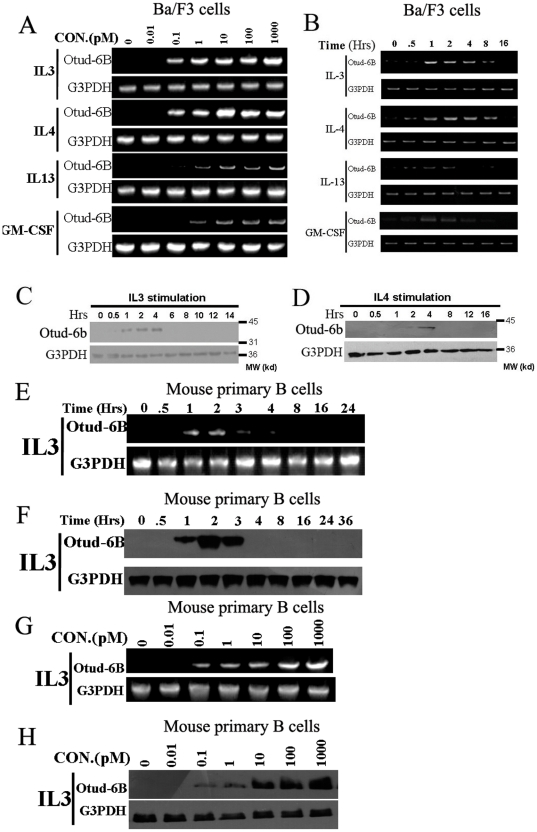
Figure 2. Otud-6b expression is induced by cytokines following by a rapid decline.
A. Otud-6b RNA level in Ba/F3 cells after starvation and two hours stimulation with different concentrations (0, 0.01, 0.1, 1, 10, 100, and 1000 pM) of mouse IL-3, IL-4, IL-13, and GM-CSF. B. Otud-6b RNA level in Ba/F3 cells after starvation and stimulation with 10 pM mouse IL-3, IL-4, IL-13, and GM-CSF for the indicated times (0, 0.5, 1, 2, 4, 8, and 16 hours). C&D. Ba/F3 cells were starved and stimulated with 10 pM mouse IL-3 or IL-4 for the indicated time. Otud-6b expression of the Ba/F3 cell lysates was immunoblotted using anti-OTUD-6B antibody. G3PDH was used as a loading control. E&F. Otud-6b RNA level and protein level in primary mouse B cells after starvation and stimulation with 10 pM mouse IL-3 for the indicated times (0, 0.5, 1, 2, 3, 4, 8, 16, and 24 hours). G3PDH was used as a loading control. G&H. Otud-6b RNA level in primary mouse B cells after starvation and two hours stimulation with different concentrations (0, 0.01, 0.1, 1, 10, 100, and 1000 pM) of mouse IL-3. G3PDH was used as a loading control.

