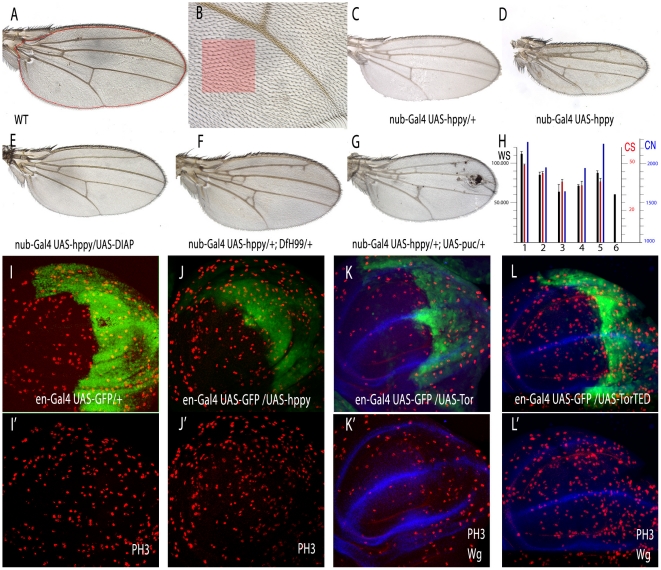
Figure 3. Wing size and cell size phenotypes caused by hppy and Tor over-expression and their relationships with mitosis.
(A–B) Wild type control wings at 5× and 20× magnifications, showing the regions used to measure wing area (A, red line) and cell density (light red square in B). (C–D) Wing phenotypes caused by different levels of hppy over-expression in nub-Gal4 UAS-hppy /+ (C) and nub-Gal4 UAS-hppy /nub-Gal4 UAS-hppy (D) wings. (E–G) Wing phenotypes of genetic combinations in which cell death is suppressed or reduced in the background of hppy over-expression. (E) nub-Gal4 UAS-hppy /UAS-DIAP; (F) nub-Gal4 UAS-hppy /+; Df(3L)H99/+; (G) nub-Gal4 UAS-hppy /+; UAS-puc/+. (H) Wing measures of the genotypes showed in A–G. Wing size is shown in the black columns (WS), cell number in the red ones (CS) and estimated cell number in the blue ones (CN). Numbers 1–6 correspond to the following genotypes: nub-Gal4/+ (1), nub-Gal4 UAS-hppy /+ (2); nub-Gal4 UAS-hppy/nub-Gal4 UAS-hppy (3); nub-Gal4 UAS-hppy/UAS-DIAP (4); nub-Gal4 UAS-hppy/+; DfH99/+ (5) and nub-Gal4 UAS-hppy /+ UAS-puc/+ (6). (I–L) Expression of PH3 (red) in wild type wing discs (I–I'), en-Gal4 UAS-GFP/UAS-hppy (J–J'), en-Gal4 UAS-GFP/UAS-Tor (K–K') and en-Gal4 UAS-GFP/UAS-TorTED (L–L'). The expression of GFP is in green. The corresponding red and blue (showing Wingless expression) channels are shown below (I'–L').

