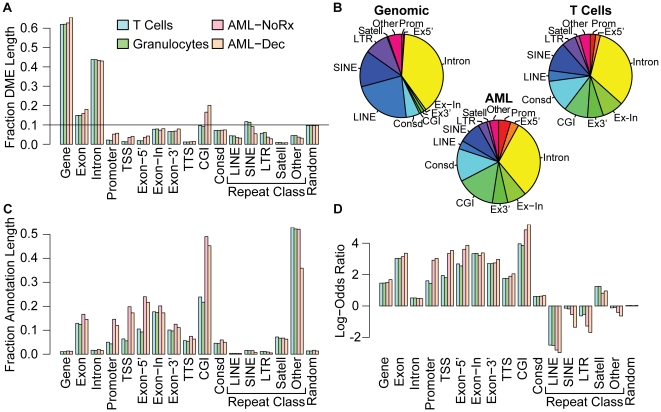
Figure 3. Genomic distribution of Densely-Methylated Elements (DMEs).
(A) The fraction of the genomic DME span overlapping the indicated UCSC genome browser annotation tracks is shown for normal human T cells (blue bars), granulocytes (green bars) and an AML-derived cell line (M091) that was treated with decitabine (orange bars) or left untreated (pink bars). Gene, Promoter, TSS, TTS, Exon, Intron, Exon-5′, Exon-3′, and Exon-In represent the entire gene body, the region −1000 bp upstream of the TSS, the 500 bp surrounding the TSS or TTS, all exons, all introns, and the first, last or middle exons, respectively. Also annotated are CGIs, the most conserved genomic elements (Consd), various repeat classes and a group of random genomic loci comprising 10% of the genome (Random). The sum of the DME fractions is greater than one because DMEs may hit more than one annotation due to overlap of some genomic annotations. (B) The proportion of the genome allocated to each annotation (left panel) is compared to the proportional size of DMEs within each annotation for T cells (right panel) and for the AML-derived cell line (lower panel). For clarity, gene bodies are excluded. (C) The fraction of the annotation span overlapping DME is shown for normal human T cells (blue bars), granulocytes (green bars) and an AML-derived cell line that was treated with decitabine (orange bars) or left untreated (pink bars), as described for (A). (D) The log-odds ratio for the extent of DME overlap compared to that expected from the relative genomic span of the annotation is shown as described for (A).

