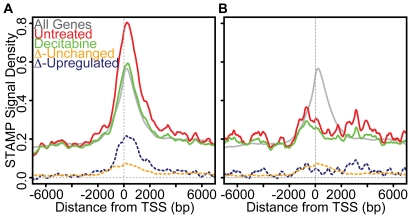
Figure 7. Decitabine induced hypomethylation of the first exonic region is associated with transcriptional activation.
(A) Profiles of the composite methylation density surrounding the TSS of transcripts upregulated by decitabine are shown before (red) and after (green) decitabine treatment of M091 cells. For comparison, the composite methylation profile of all genes is shown as in Fig. 5A (grey). Also show is the change in methylation seen for transcripts that are upregulated (blue dashed line) or unchanged (orange dashed line) following decitabine treatment. (B) Profiles of the composite methylation density surrounding the TSS of transcripts downregulated by decitabine are shown before (red) and after (green) decitabine treatment. For comparison, the composite methylation profile of all genes is shown as in Fig. 5A (grey). Also show is the change in methylation seen for transcripts that are downregulated (blue dashed line) or unchanged (orange dashed line) following decitabine treatment.

