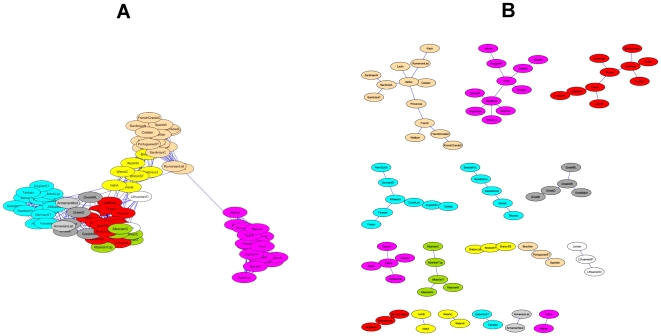
Figure 4. A force-directed layout using Cytoscape [3].
The figure shows the result of a force directed layout algorithm on a popular software package used in bioinformatics. Figure (A) uses the 10 nearest neighbor graph (and should be compared with Figure 3C) and (B) shows the result when we use the MST (and could be compared with that of Figure 3B). In (A) the layout is not clear and it only shows part of the graph structure. In (B) the structure of the MST is represented, but the location of the clusters in respect to each other is not guided by inter cluster similarities so the final layout misses important relationships. The color coding of these languages helps us to illustrate that our QAPgrid allows us to preserve important similarities between the clusters.

