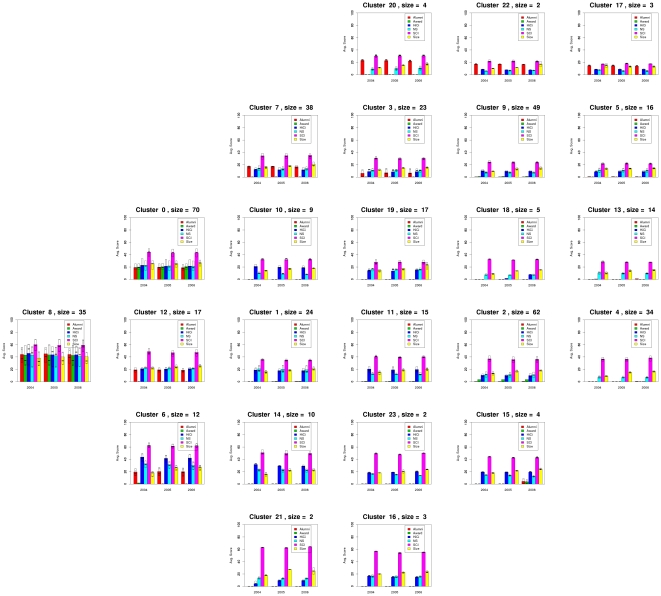
Figure 6. Aggregated performance profiles of the universities in each cluster using the same layout as that of Figure 5.
This figure shows the profile of each one of the clusters found by MSTkNN and clearly demonstrates the ability of QAPgrid to locate together clusters with similar profiles across the three consecutive years of this study. For each year the score for Alumni, Award, HiCi, NS, SCI and Size of the components of the cluster is shown. For each category we also include a box representing the first and third quartile. The best universities are located in clusters towards the left marging of the figure. We appreciate the different “avenues” to academic excellence. Some institutions (see for instance Cluster 21) are highly productive in terms of their SCI results but still lack behind in the Alumni, Award, and HiCi rankings. As a consequence of the layout and the analysis of this figure, we have recognized the strong profile of the group of universities in Cluster 6 (a group that includes Duke University, Boston University, McGill University, etc.) and other which were perhaps disadvantaged by the weighting scheme in Shanghai Jiao Tong University Ranking scheme (like Tohoku University, in Cluster 12) that shares a position in this cluster with peers Osaka University and Tokyo Institute of Technlogy. We refer the reader to the comprehensive online supplementary material to investigate the location of individual universities (File S2).

