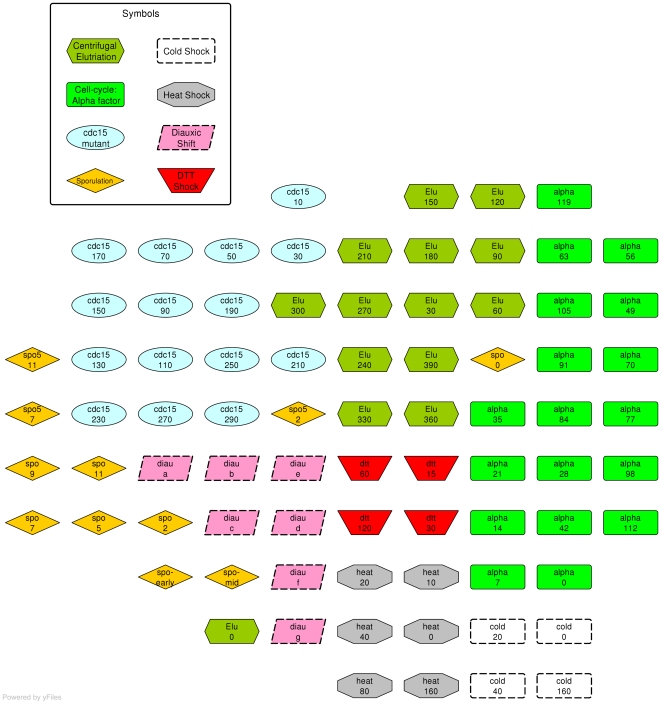
Figure 9. Final layout produced by QAPgrid of the 79 samples of Eisen's yeast dataset [43].
The samples were colored after the layout was obtained according to the experiment in which they belong. We can see that the samples location correlate well with the experiment to which they belong, with the obvious exception of some of them due to the fact that they are initial/early states. We refer to Figure 10 and Table 2 for related results.

