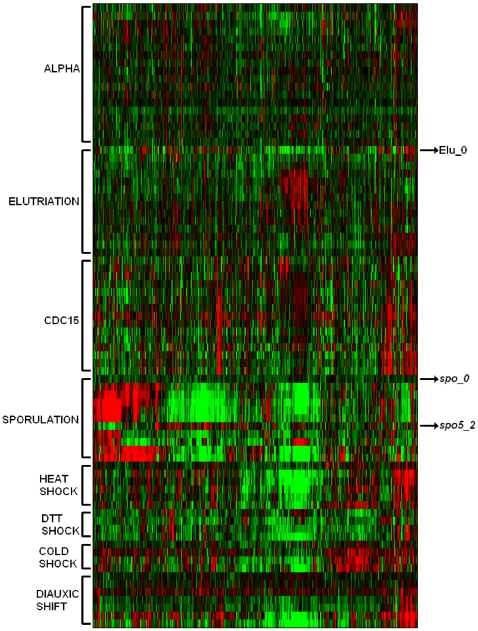
Figure 10. A traditional heatmap representation of the expression of the 79 samples on the 2,467 genes.
Each group of samples is separated according to the experiment ordered using the Memetic Algorithm described in Ref. [31]. It is clear to see that the expression of those samples is very different from the others in the group that has the same label.

