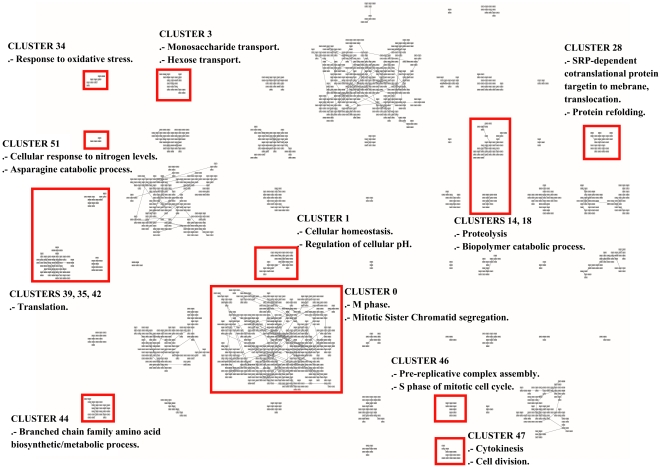
Figure 13. Grid layout of the 2,467 gene probes of Eisen's yeast dataset.
In this Figure, as well as in Figures 14 and 15, we highlight a GO term which has been uniquely and statistically well-associated to a single particular cluster. In such a way, we highlight the unique biological annotation associated to each clusters.

