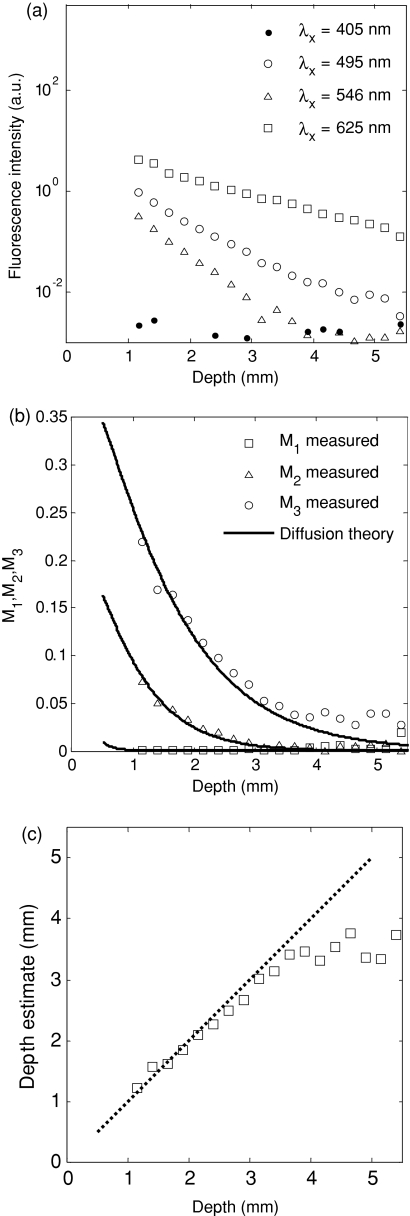
Figure 3.
(a) Fluorescence intensity as a function of capillary tube depth (measured from the top surface of the tube) in the tissue-simulating phantom, for the different excitation wavelengths; (b) M1, M2, and M3 as a function of capillary tube depth, with the solid lines being the diffusion model predictions; (c) depth estimate of the capillary tube compared to the true depth (the dashed line is the line of equality: R2 = 0.918 for depths up to 3 mm).

