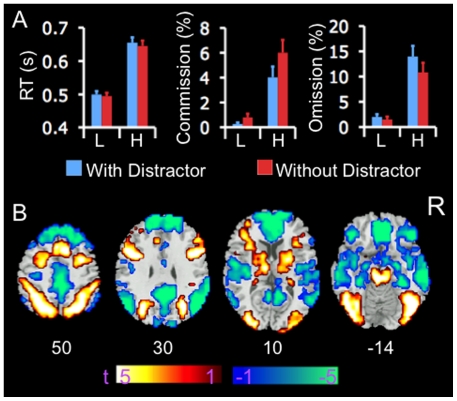
Figure 2. Performance data and BOLD signal changes on the task.
A). Error bar indicates standard error of means. Perceptual load showed main effects on commission and omission errors and on RT. Distractors showed significant main effects on commission and omission errors, but only a trend on RT. Perceptual loads and distractors showed a significant two-way interaction with respect to commission errors, and trended towards a significant two-way interaction with respect to omission errors. B) Color on T1 template image from SPM2 indicates significant increases (red color) and decreases (blue color) in BOLD signal in the condition of high relative to low perceptual load, collapsed across distractor conditions. The color bar indicates t value. The number under each brain image indicates the Z coordinate of the image in the MNI (Montreal Neurological Institute) template space. The only voxels displayed on the brain images are those surviving voxel threshold <.01 and cluster level p<.05, FWE corrected for multiple comparisons of voxel-wise whole brain analysis. Abbreviations: L: low load; H: high load; R: right side; RT: reaction time.

