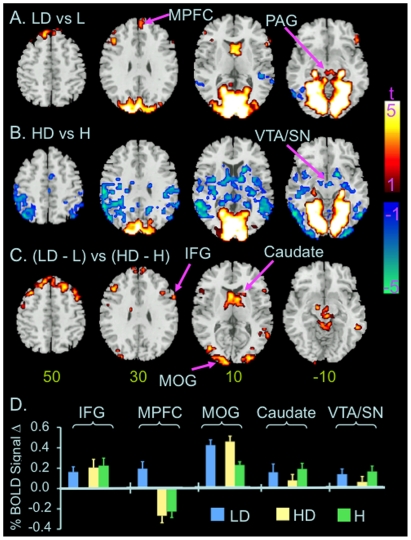
Figure 3. Distractor related changes in BOLD signal at different perceptual load.
Color on T1 template images from SPM2 indicates significant distractor-related increases (red color) or decreases (blue color) in BOLD signal in the conditions of low (A) and high perceptual load (B), and differences in distractor-related changes in BOLD signal at low vs. high perceptual load (C). The color bar indicates t value. The number under each brain image at the bottom row indicates the Z coordinate of the brain image in the MNI (Montreal Neurological Institute) template space. The only voxels displayed on the brain images are those surviving voxel threshold <.01 and cluster level p<.05, FWE corrected for multiple comparisons of voxel-wise whole brain analysis. D) Bar graphs show changes in BOLD signal in the labeled ROIs. The level of BOLD signal at the condition of low load without distractor was defined as baseline (0). Error bars indicates standard errors of means. Abbreviation: H: high load without distractor; HD: high load with distractors; IFG: inferior frontal gyrus; L: low load without distractors; LD: low load with distractors; MOG: middle occipital gyrus; MPFC: medial prefrontal cortex; PAG: periaqueductal gray; R: right; SFG: superior frontal gyrus; VTA/SN: ventral tegmental area and adjacent substantia nigra.

