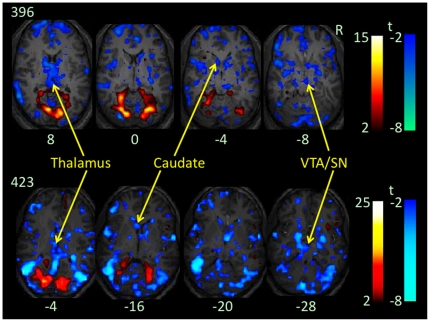
Figure 4. Distractor-related changes in BOLD signal at high load in the native space.
Color on T1 anatomical images of two participants (396 and 423) without spatial normalization indicate increases (red color) or decreases (blue color) in BOLD signal at contrast high load (with distractors vs. without distractors). Voxel level threshold is p<.01 without corrections for multiple comparisons of voxel-wise whole brain analysis. The number under each brain image indicates the Z coordinate of the brain image in their original space. Please note decreases in BOLD signal in the caudate head, thalamus, and ventral tegmental area and adjacent substantia nigra (VTA/SN).

