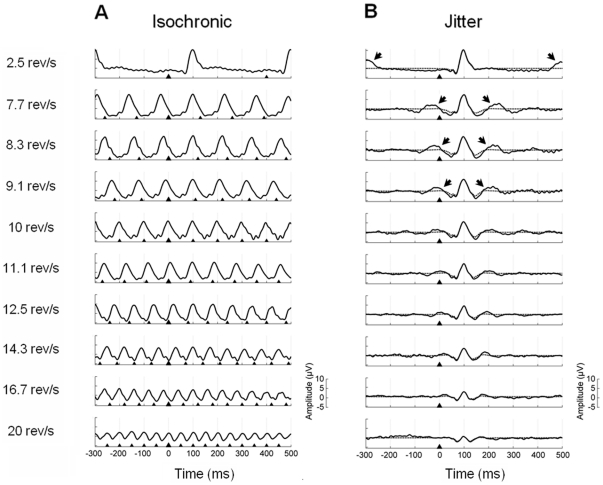
Figure 6. Grand-average waveforms at the Oz lead for both isochronic and jitter conditions (Experiment 2).
A, Recorded waveforms (800 ms time window; 300 ms pre-stimulus) for the isochronic stimulation conditions, including one stimulation rate characteristic of transient ERPs (2.5 rev/s) and nine typical SSR reversal rates ranging from 7.7 to 20 rev/s. The triangles indicate stimuli onset; the largest triangle represents the zero time point. B, Grand-average waveforms of the corresponding jitter conditions are shown in solid line. Reminiscent activity from preceding and forthcoming stimuli has been marked by arrows. The Gaussian-modulated waveforms used as transient templates in the synthesis procedure are shown in dashed line.

