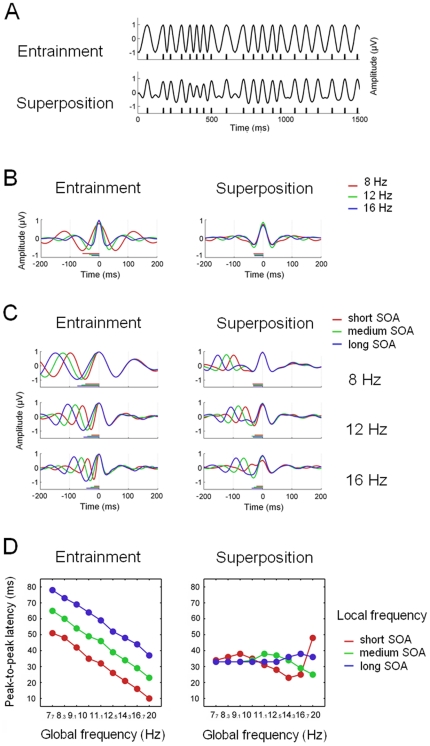
Figure 9. Simulation of the influence of both global and local stimulation frequency on the shape of the average ERP.
A, Example of the response elicited by a jittered stimulation train in both the oscillatory entrainment and the superposition scenarios. B, Average waveforms for different stimulation frequencies. The solid bars along the x axis reflect the peak-to-peak latency. C, Average waveforms for trials grouped by their immediately past SOA. D, Variation in the peak-to-peak latency in both scenarios, as a function of both mean stimulation rate and local frequency.

