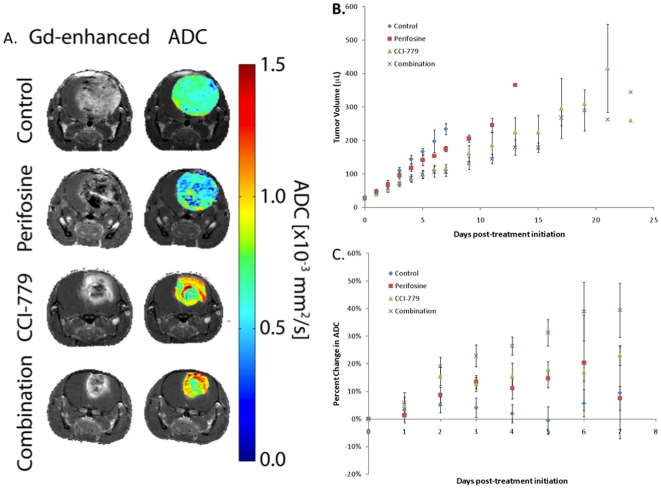
Figure 5. In vivo imaging of therapeutic response using contrast enhanced diffusion weighted MRI.
(A) MR gadolinium (Gd) contrast-enhanced T1-weighted images and ADC color overlay maps demonstrate effects of in vivo effects of treatment with obtained from representative control, perifosine, CCI-779 and combination (perifosine + CCI-779) treated glioma mice at 5-7 days post-initiation of therapy. (B) Plot of mean MRI-determined tumor volumes based upon Gd-contrast enhanced regions versus time post-treatment initiation for control, perifosine, CCI-779 and combination (perifosine + CCI-779) treated mice. (Error bars ± SEM). (C) Plot of percent change of mean ADC values versus time post-treatment initiation for control, perifosine, CCI-779 and combination (perifosine + CCI-779) treated mice. (Error bars ± SEM).

