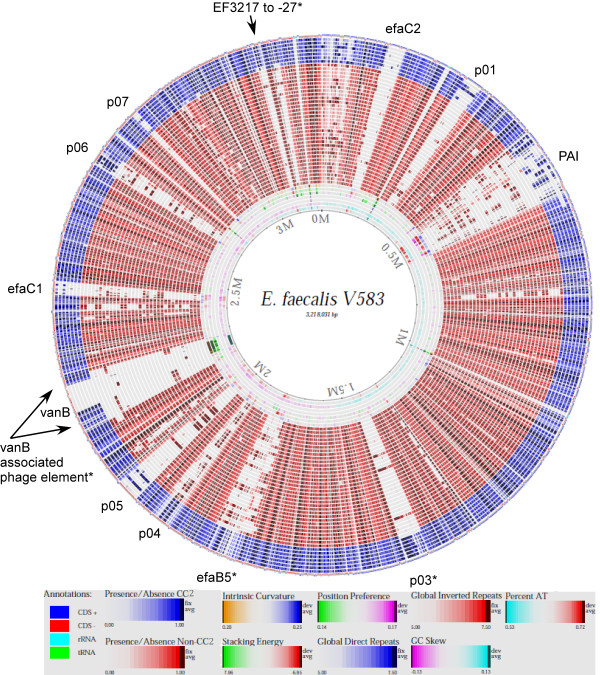
Figure 1.
Genome-atlas presentation of CGH data compared to the V583 genome and arranged by clonal relationship according to MLST. From inner to outer lanes: 1) percent AT, 2) GC skew, 3) global inverted repeats, 4) global direct repeats, 5) position preference, 6) stacking energy, 7) intrinsic curvature, 8) 189, 9) LMGT3208, 10) LMGT3407, 11) 92A, 12) 29C, 13) E1960, 14) 111A, 15) 105, 16) E2370, 17) 84, 18) 383/04, 19) E1188, 20) Vet179, 21) EF1841, 22) E1807, 23) LMGT3143, 24) LMGT3405, 25) OG1RF, 26) 2426/03, 27) LMGT3406, 28) 85, 29) E1052, 30) 1645, 31) LMGT3209, 32) LMGT2333, 33) 597/96, 34) 62, 35) Vet138, 36) 266, 37) UC11/96, 38) Symbioflor 1, 39) 3339/04, 40) 82, 41) E1834, 42) E4250, 43) LMGT3303, 44) 158B, 45) MMH594, 46) 372-56, 47) 609/96 and 48) annotations in V583. Elements enriched in CC2-strains are indicated with an asterisk.

