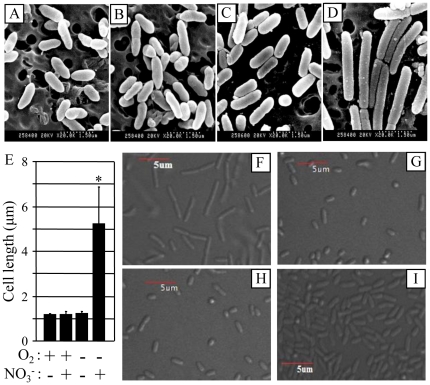
Figure 1. NO3 − respiration-induced cell elongation of PAO1.
(A–D) Scanning electron microscope (SEM) images of PAO1 grown in LB (A and C) or LB containing 0.4% NO3 − (B and D) either aerobically (A and B) or anaerobically (C and D). Cells were grown for 15 hours prior to processing for SEM. The images were acquired at a magnification of 20,000 and scale bar of 1.5 µm is indicated at the bottom right. (E) Cell length was determined with software-aided distance measurement as described in experimental procedures. For statistical significance, more than 100 cells were selected for measurement in each image and mean ± SEM (standard error of mean) was presented. *p<0.001 vs. cells shown in the other three images. (F–H) DIC images of PAO1 (F), ΔnorC (G) and Δanr (H) grown in LB+0.4% NO3 − under anaerobic environment. (I) DIC image of PAO1 grown in LB +30 mM arginine under anaerobic environment. Acquisition of DIC images was conducted as described in materials and methods.

