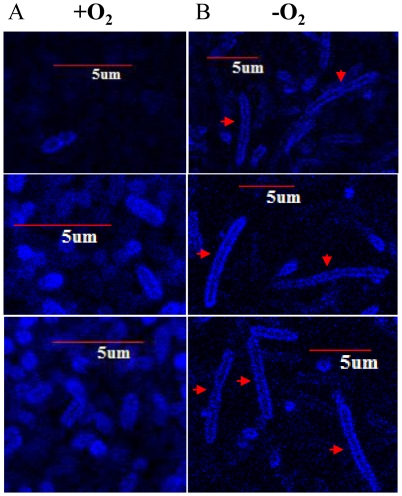
Figure 2. Confocal microscopic image analysis of cell membrane of elongated P. aeruginosa.
PAO1 grown in LB+0.4% NO3 − either aerobically (A) or anaerobically (B) was stained with 10 µM TMA-DPH for the visualization of cell membrane. Three different images per sample are displayed. 5 µm scale bars were incorporated to clearly compare the cell length between two cultures. Red arrows indicate highly elongated cells. Image analysis was performed as described in materials and methods.

