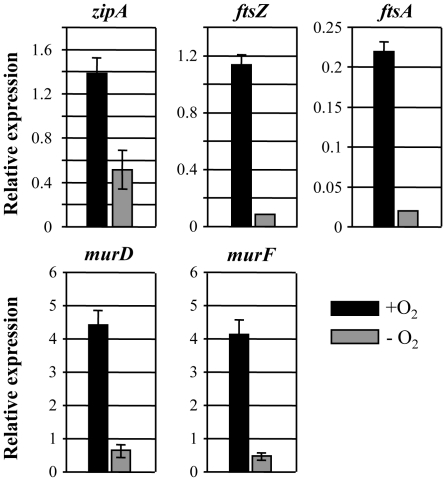
Figure 4. Quantitative RT-PCR analysis of genes involved in cell division and peptidoglycan synthesis.
qRT-PCR was conducted on cDNA synthesized from 2 µg total RNA extracted from PAO1 grown either aerobically (black bars) or anaerobically (gray bars). Transcript levels of 5 genes indicated on top of each graph were normalized with levels of the rpoD transcript. Three independent experiments were performed and values of mean ± SEM are displayed in each bar.

