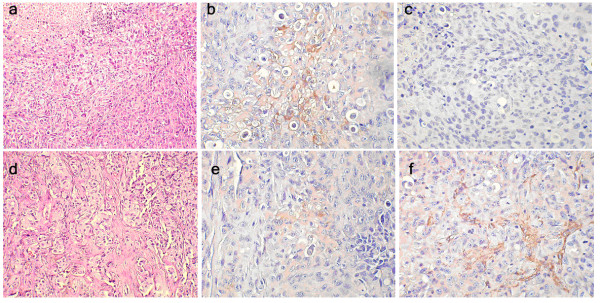
Figure 2.
MiRNAs expression profiles by microarray with Q-RT-PCR verification. Haematoxylin and eosin (H&E) staining and immunohistochemical staining are shown on pathology sections of tumors implanted in NOD/SCID mice. In a, b and c, the staining showed a single cell type by H&E (100×), EMA-positive cells (200×) and SMA-negative cells (200×), respectively, for the MCF-7 group. In d, e and f, the staining showed at least two cell types by H&E (100×), EMA-positive cells (200×) and SMA-positive cells (200×), respectively, for the BCSC group.

