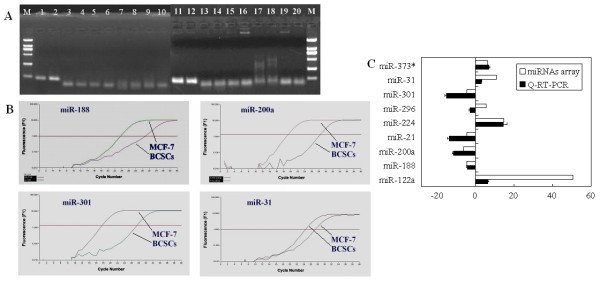
Figure 3.
Q-RT-PCR verification of miRNA expression. Gel electrophoresis showed clear and specific bands for all the Q-RT-PCR reactions (A). The amplification curves in the PCR reactions were also clear. Parts of the amplification curves for miR-188, miR-200a miR-301 and miR-31 are shown (B). Ten miRNAs were compared between BCSCs and MCF-7 cells by Q-RT-PCR. Eight of the nine miRNAs tested by real-time RT-PCR gave results consistent with the microarray data, except miR-296, indicating a concordance rate of 88.89% (C).

