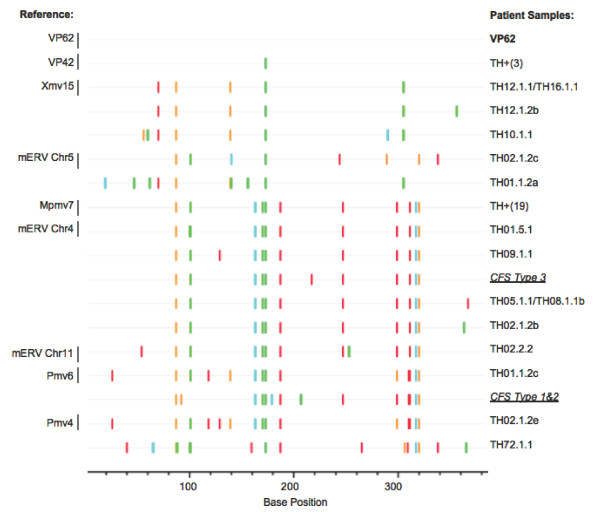
Figure 3.
Gag sequences from patient samples. Individual 382 bp sequences, free of double peaks and confirmed through forward and reverse sequencing, are compared in a Highlighter plot to the control WPI-1282 cell line sequence, VP62. The samples were coded to remain anonymous, with the first number being the patient number, the second number being the bleed number, the third number being the tube of DNA, and the letter showing that we have multiple sequences in the same tube of DNA. Identical sequences were collapsed into individual clusters, those with more than two sequences are labeled TH+(N), where N is the total number of sequences in that cluster. CFS Type 1, 2 & 3 are from Lo et al. [15]. Each vertical line shows a single nucleotide difference between the labeled sequence and the control VP62 sequence.

